TrendSpider has emerged as a revolutionary tool in the trading world, offering a blend of advanced technical analysis, automated features, and educational resources. Whether you’re a seasoned trader or just starting out, understanding how to effectively utilize TrendSpider can significantly enhance your trading strategies and decision-making processes. In this comprehensive guide, we’ll delve into the various aspects of TrendSpider, from basic functionalities to advanced features, and how you can tailor them to suit your individual trading style. Join us as we explore the full potential of TrendSpider, a platform that’s redefining the landscape of trading tools.
Table of Contents
Getting Started with TrendSpider
Embarking on your trading journey with TrendSpider can be both exciting and overwhelming. This guide aims to simplify the process, helping you get started with ease. TrendSpider is a powerful tool for traders, offering advanced charting, automated technical analysis, and a suite of features to enhance your trading experience.
Setting Up Your TrendSpider Account
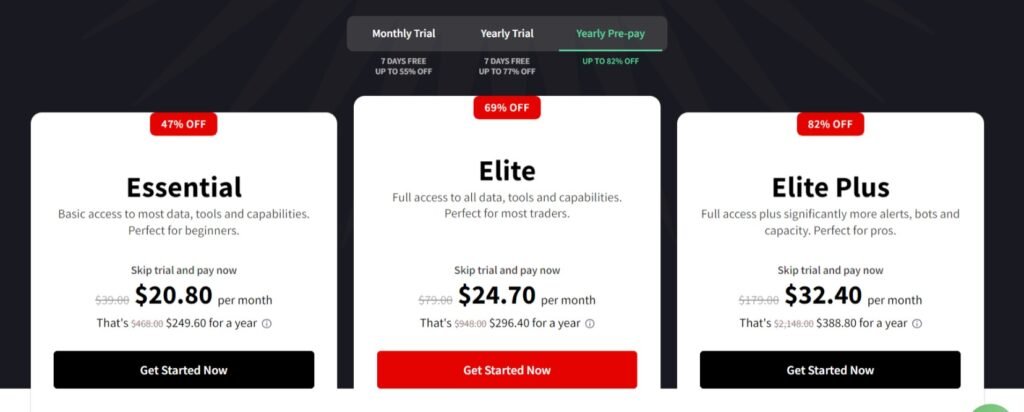
The first step in using TrendSpider is to create an account. Visit the TrendSpider website and choose a plan that suits your trading needs. They offer various options, from basic to advanced, catering to different levels of trading expertise.
Navigating the Interface
Once you’ve set up your account, take some time to familiarize yourself with the TrendSpider interface. The platform is designed to be user-friendly, but like any new tool, it takes a bit of exploration to get comfortable.
Customizing Your Workspace
TrendSpider allows you to customize your workspace to suit your trading style. You can set up different chart layouts, choose from various technical indicators, and even customize the color scheme to your preference.
Connecting to Markets
To start trading, you need to connect TrendSpider to the markets you’re interested in. The platform offers data from a wide range of markets, including stocks, forex, and cryptocurrencies.
Placing Your First Trade
With your account set up and your workspace customized, you’re ready to place your first trade. TrendSpider provides detailed charts and tools to analyze market trends, helping you make informed decisions.
Utilizing Educational Resources
TrendSpider offers a wealth of educational resources. Whether you’re a beginner or an experienced trader, these resources can provide valuable insights into using the platform effectively.
Getting started with TrendSpider is just the beginning of your trading journey. As you become more familiar with the platform, you’ll discover its full potential in helping you make informed trading decisions. Remember, the key to successful trading is not just the tools you use, but also your understanding of the markets and your trading strategy.
Understanding the Dashboard
Navigating the TrendSpider dashboard is a critical step in harnessing the full potential of this powerful trading tool. This section will guide you through the key features of the TrendSpider dashboard, ensuring you can utilize it effectively for your trading analysis.
Overview of the Dashboard
The TrendSpider dashboard is your command center. It provides a comprehensive view of the market data, charts, and tools you need for your trading decisions. The layout is intuitive, designed to give traders quick access to all necessary features.
Key Features of the Dashboard
- Chart Area: This is where you’ll spend most of your time. The chart area displays real-time market data and allows you to apply various technical analysis tools and indicators.
- Tool Panel: Located typically on the left side, the tool panel gives you access to TrendSpider’s wide array of charting tools, indicators, and settings.
- Market Data Overview: This section provides a quick snapshot of the market, including prices, trends, and key indicators.
- Alerts and Notifications: Stay updated with real-time alerts and notifications that can be customized to your trading strategy.
Customizing the Dashboard
TrendSpider allows you to tailor the dashboard to your preferences. You can rearrange panels, modify the layout, and choose which information is displayed prominently. This customization ensures that the dashboard meets your specific trading needs.
Utilizing Multi-Window Views
For advanced traders, TrendSpider offers multi-window views. This feature allows you to monitor multiple charts and timeframes simultaneously, a crucial aspect for dynamic trading strategies.
Navigating Between Different Tools and Features
Efficiently moving between different tools and features on the dashboard is key to a seamless trading experience. Familiarize yourself with the navigation bar, quick access menus, and keyboard shortcuts to enhance your efficiency.
Chart Analysis Fundamentals
Mastering chart analysis is crucial for any trader using TrendSpider. This section will cover the fundamentals of chart analysis within the TrendSpider platform, providing you with the foundational knowledge to interpret and utilize these charts effectively.
Introduction to Chart Types
TrendSpider offers a variety of chart types to suit different trading styles and analysis needs. Understanding the differences between line charts, bar charts, candlestick charts, and others is essential.
Reading TrendSpider Charts
- Candlestick Patterns: Learn to read candlestick patterns, as they are a key element in understanding market sentiment and potential price movements.
- Price and Volume: Analyzing the relationship between price and volume can give insights into the strength or weakness of a market trend.
- Support and Resistance Levels: Identifying these levels on charts helps in predicting price movements and making informed trading decisions.
Utilizing Technical Indicators
TrendSpider provides a range of technical indicators like moving averages, RSI, MACD, and Bollinger Bands. Understanding how to apply and interpret these indicators is vital for effective chart analysis.
Applying Trend Lines and Drawing Tools
TrendSpider’s drawing tools allow you to add trend lines, Fibonacci retracements, and other technical analysis tools to your charts. These tools can help in identifying trends and potential reversal points.
Analyzing Timeframes
Different trading strategies require analyzing various timeframes. TrendSpider allows you to view multiple timeframes simultaneously, providing a comprehensive picture of market trends.
Utilizing Automated Technical Analysis
Automated technical analysis is a standout feature of TrendSpider, designed to streamline and enhance the trading process. This section delves into how you can leverage this powerful feature to make more informed trading decisions.
Understanding Automated Analysis in TrendSpider
TrendSpider’s automated technical analysis uses advanced algorithms to analyze market data and identify patterns. This feature saves time and reduces the likelihood of human error in chart analysis.
Setting Up Automated Analysis
To begin using automated analysis, you’ll need to select your preferred markets and set your analysis criteria. TrendSpider allows customization of these parameters to align with your trading strategy.
Interpreting Analysis Results
Once you run the automated analysis, TrendSpider provides a detailed breakdown of the findings. It’s crucial to understand how to interpret these results, which include trend lines, patterns, and potential buy/sell signals.
Integrating Automated Analysis with Manual Techniques
While automated analysis is powerful, combining it with manual chart analysis techniques can provide a more comprehensive market view. This blended approach can enhance the accuracy of your trading decisions.
Best Practices for Automated Technical Analysis
To maximize the benefits of TrendSpider’s automated analysis, familiarize yourself with best practices. This includes regularly updating your analysis criteria and cross-referencing results with current market news and events.
Advanced Charting Tools
TrendSpider is renowned for its suite of advanced charting tools, which are essential for traders looking to conduct in-depth market analysis. This section will explore these tools and how they can be effectively utilized in your trading strategy.
Exploring TrendSpider’s Charting Capabilities
TrendSpider offers a range of advanced charting tools that go beyond basic line and bar charts. These include candlestick patterns, heatmaps, raindrop charts, and more. Each tool provides unique insights into market trends and potential trading opportunities.
Candlestick Pattern Recognition
One of the most powerful features of TrendSpider is its ability to automatically recognize and highlight candlestick patterns. This tool is invaluable for traders who rely on candlestick patterns to make trading decisions.
Utilizing Heatmaps for Price Analysis
Heatmaps in TrendSpider provide a visual representation of price movements and concentrations over a specified period. They help in identifying areas of support and resistance and can be a critical tool in your analysis arsenal.
The Power of Raindrop Charts
Raindrop Charts are a unique feature of TrendSpider, combining price action and volume in a single visual representation. They offer a more nuanced view of market movements compared to traditional candlestick charts.
Multi-Timeframe Analysis
TrendSpider allows you to view multiple timeframes on a single chart, providing a comprehensive view of both short-term and long-term trends. This feature is crucial for traders who operate on different time horizons.
Customizing Chart Indicators
With TrendSpider, you can customize a wide range of technical indicators to suit your trading style. From moving averages to RSI and Bollinger Bands, the ability to tailor these indicators is key to personalized chart analysis.
Dynamic Price Alerts Setup
In the fast-paced world of trading, staying informed about market movements is crucial. TrendSpider’s dynamic price alerts system is a powerful feature that keeps you updated in real-time. This section will guide you through setting up and managing these alerts effectively.
The Importance of Price Alerts in Trading
Price alerts in TrendSpider are essential for monitoring market changes without having to constantly watch the charts. They notify you when certain price conditions are met, enabling timely decision-making.
Setting Up Price Alerts in TrendSpider
- Choosing the Right Conditions: Start by determining the conditions under which you want to receive alerts. This could be when a stock reaches a specific price, breaks a trend line, or meets certain technical criteria.
- Creating an Alert: Navigate to the chart of your chosen instrument in TrendSpider. Right-click on the chart or use the alert icon to set up a new alert. You can specify the condition, such as a price level or technical indicator threshold.
Customizing Alert Parameters: TrendSpider allows you to customize the parameters of your alerts, including the frequency of notifications and the channels through which you receive them (e.g., email, SMS, in-app notifications).
Managing Your Alerts
Once your alerts are set up, managing them is straightforward. You can view all your active alerts, modify their conditions, or delete them as your trading strategy evolves.
Best Practices for Using Price Alerts
To make the most out of TrendSpider’s price alerts, it’s important to:
- Avoid Overloading: Set alerts that are crucial for your trading strategy to avoid being overwhelmed by notifications.
- Regularly Review and Update: Market conditions change, so regularly review and update your alerts to ensure they remain relevant.
Multi-Timeframe Analysis
Multi-timeframe analysis is a crucial aspect of trading, and TrendSpider excels in providing this feature. This section will explore how to effectively use multi-timeframe analysis in TrendSpider to gain a comprehensive view of market trends and make more informed trading decisions.
Understanding Multi-Timeframe Analysis
Multi-timeframe analysis involves looking at the same asset across different time periods to get a broader understanding of the market trend. This approach helps in identifying both short-term and long-term trading opportunities.
Setting Up Multi-Timeframe Views in TrendSpider
- Selecting Timeframes: In TrendSpider, you can view multiple charts side-by-side, each set to a different timeframe. Commonly used timeframes include 1-minute, 15-minute, 1-hour, daily, and weekly charts.
- Synchronizing Charts: Ensure that your charts are synchronized in terms of the asset being analyzed. This allows for a cohesive analysis across different timeframes.
Analyzing Trends Across Timeframes
When using multi-timeframe analysis, look for trends and patterns that are consistent across timeframes. This can include identifying support and resistance levels, trend lines, and chart patterns.
Integrating Indicators and Tools
TrendSpider allows you to apply technical indicators and tools to each timeframe independently. This feature is particularly useful in validating trends and signals across different timeframes.
Benefits of Multi-Timeframe Analysis
Using multi-timeframe analysis in TrendSpider can significantly enhance your trading strategy by:
- Providing a more comprehensive view of market trends.
- Helping in identifying both short-term and long-term trading opportunities.
- Reducing the risk of false signals by cross-verifying trends across timeframes.
Pattern Recognition with TrendSpider
Pattern recognition is a fundamental aspect of technical analysis in trading. TrendSpider enhances this process with its advanced pattern recognition capabilities. This section will guide you through utilizing TrendSpider for effective pattern recognition in your trading strategy.
The Role of Pattern Recognition in Trading
Pattern recognition involves identifying specific patterns in chart data that can indicate potential market movements. These patterns, such as head and shoulders, triangles, or flags, can provide insights into future price action.
Utilizing TrendSpider’s Pattern Recognition Tools
TrendSpider automates the process of identifying chart patterns, making it easier and more efficient for traders. This feature scans and highlights potential patterns on your charts in real-time.
- Accessing Pattern Recognition Features: Learn how to activate and use TrendSpider’s pattern recognition tools on your charts.
- Interpreting Recognized Patterns: Once a pattern is identified, understanding its implications is crucial for making informed trading decisions.
Customizing Pattern Recognition Settings
TrendSpider allows you to customize the sensitivity and types of patterns you want the system to identify. This customization ensures that the patterns recognized align with your specific trading style and strategy.
Cross-Verification with Other Analysis Tools
While pattern recognition is powerful, cross-verifying these patterns with other technical analysis tools and indicators can provide a more robust trading strategy.
Best Practices for Using Pattern Recognition
To effectively use TrendSpider’s pattern recognition:
- Understand Pattern Limitations: Recognize that no pattern is foolproof. Always consider the broader market context.
- Combine with Fundamental Analysis: For a holistic approach, combine pattern recognition with fundamental analysis of the asset.
Backtesting Strategies
Backtesting is a critical process in trading, allowing traders to test their strategies against historical data to gauge their effectiveness. TrendSpider provides robust tools for backtesting, enabling traders to refine their strategies with confidence. This section will guide you through the process of backtesting strategies using TrendSpider.
Understanding the Importance of Backtesting
Backtesting involves simulating a trading strategy using historical data to assess its potential success. This process helps traders identify and refine strategies before applying them in real-time trading.
Setting Up Backtesting in TrendSpider
- Selecting Historical Data: Choose the historical time period over which you wish to test your strategy. TrendSpider offers a wide range of historical data for comprehensive backtesting.
- Defining Your Strategy: Clearly define the rules of your trading strategy, including entry, exit, and money management criteria.
Running the Backtest
Once your strategy is defined, run the backtest in TrendSpider. The platform will simulate trades based on your strategy against the selected historical data.
Analyzing Backtesting Results
After completing the backtest, analyze the results to understand the performance of your strategy. Look for key metrics like total return, win/loss ratio, drawdown, and other relevant statistics.
Tweaking and Refining Your Strategy
Based on the backtesting results, make necessary adjustments to your strategy. This might involve tweaking trade entry points, stop-loss levels, or other parameters to improve performance.
Best Practices for Backtesting
Effective backtesting requires a disciplined approach. Ensure your backtesting is realistic by including transaction costs, considering market liquidity, and avoiding overfitting your strategy to historical data.
Integrating Market Data and Indicators
Effective trading strategies often rely on a combination of market data and technical indicators. TrendSpider excels in integrating these elements, providing traders with a comprehensive toolkit for market analysis. This section will guide you on how to effectively integrate market data and indicators using TrendSpider.
The Significance of Market Data and Indicators
Market data, including price movements, volume, and historical trends, combined with technical indicators, forms the backbone of technical analysis. Understanding how to integrate these can significantly enhance your trading decisions.
Accessing Market Data in TrendSpider
TrendSpider provides real-time and historical market data across various assets. Accessing this data is straightforward:
- Selecting Your Asset: Choose the asset you wish to analyze from TrendSpider’s extensive list.
- Viewing Historical Data: Utilize the platform’s features to view historical price and volume data.
Utilizing Technical Indicators
TrendSpider offers a wide range of technical indicators, such as moving averages, RSI, MACD, and Bollinger Bands. These indicators can be applied to the market data to identify trends, momentum, and potential entry and exit points.
Integrating Market Data with Indicators
The true power of TrendSpider lies in its ability to seamlessly integrate market data with technical indicators. This integration allows for a more nuanced and comprehensive market analysis.
- Overlaying Indicators on Price Charts: Learn how to overlay technical indicators on top of price charts for a layered analysis.
- Customizing Indicator Settings: Adjust the settings of your indicators to match your analysis needs and trading style.
Analyzing Combined Data for Trading Decisions
With market data and indicators integrated, analyze this combined information to make informed trading decisions. Look for convergence or divergence between price movements and indicator readings, which can signal potential trading opportunities.
Best Practices for Integrating Data and Indicators
To maximize the effectiveness of integrating market data and indicators:
- Understand Each Indicator: Know what each indicator represents and how it can be used in conjunction with market data.
- Avoid Overcrowding Your Charts: Use a select few indicators at a time to avoid confusion and analysis paralysis.
Risk Management Features
Risk management is a crucial aspect of successful trading, and TrendSpider offers a range of features to help traders manage and mitigate risks. This section will explore how to utilize TrendSpider’s risk management tools effectively.
Understanding the Importance of Risk Management
Effective risk management is essential for protecting your capital and ensuring long-term trading success. It involves identifying potential risks and implementing strategies to minimize their impact.
Utilizing Stop Loss and Take Profit Orders
TrendSpider allows you to set stop loss and take profit orders, which are critical for risk management. These orders automatically close your position when prices reach a certain level, helping to lock in profits and limit losses.
- Setting Up Stop Loss Orders: Determine the maximum amount you are willing to lose on a trade and set a stop loss order at this price level.
- Implementing Take Profit Orders: Decide on a profit target for your trade and set a take profit order to automatically close the position once this target is reached.
Analyzing Risk/Reward Ratios
TrendSpider can help you analyze the risk/reward ratio of potential trades. This ratio is a key metric that compares the potential risk of a trade to its potential reward.
Position Sizing Tools
Proper position sizing is vital for risk management. TrendSpider’s tools can help you determine the appropriate size for each trade based on your overall trading capital and risk tolerance.
Customizable Alerts for Risk Management
Set up customizable alerts in TrendSpider to notify you of market conditions that may increase risk, such as significant price movements or changes in volatility.
Best Practices for Risk Management in TrendSpider
To effectively manage risk using TrendSpider:
- Regularly Review and Adjust Orders: Market conditions change, so regularly review and adjust your stop loss and take profit orders.
- Balance Risk and Reward: Aim for trades where the potential reward justifies the risk.
- Use Alerts Wisely: Set alerts that are relevant to your risk management strategy to stay informed without being overwhelmed.
Educational Resources and Community
TrendSpider is not just a tool for technical analysis; it’s also a platform rich in educational resources and a vibrant community. This section will explore how to leverage these resources and the community to enhance your trading knowledge and skills.
The Value of Educational Resources in Trading
Continuous learning is essential in the ever-evolving world of trading. TrendSpider offers a wealth of educational materials, including tutorials, webinars, and articles, which are invaluable for both novice and experienced traders.
Accessing Tutorials and Guides
TrendSpider provides comprehensive tutorials and guides that cover everything from basic platform navigation to advanced trading strategies.
- Navigating to Educational Content: Learn how to find and access the educational materials on the TrendSpider platform.
- Utilizing Guides for Learning: Use these guides to understand the platform’s features and how they can be applied in your trading.
Webinars and Live Training Sessions
Regular webinars and live training sessions are conducted by experienced traders and market analysts. These sessions provide insights into market trends, trading strategies, and how to make the most of TrendSpider’s features.
Leveraging the TrendSpider Community
The TrendSpider community is a great place to connect with other traders, share strategies, and discuss market trends. Engaging with the community can provide valuable insights and support.
- Joining Community Discussions: Learn how to join and participate in forums and discussion groups within the TrendSpider community.
- Learning from Experienced Traders: Benefit from the experiences and insights shared by seasoned traders in the community.
Best Practices for Utilizing Educational Resources
To make the most out of TrendSpider’s educational resources:
- Set Learning Goals: Identify specific areas you want to learn or improve upon and focus on relevant resources.
- Apply Learning to Practice: Try to apply the concepts and strategies you learn in a simulated or real trading environment.
Customizing TrendSpider for Your Trading Style
TrendSpider is a versatile platform that caters to a wide range of trading styles. Customizing it to fit your specific trading approach can significantly enhance your trading efficiency and effectiveness. This section will guide you through personalizing TrendSpider to align with your unique trading style.
The Importance of Customization in Trading Tools
Customization allows traders to tailor their tools to their specific needs, preferences, and strategies. This personalization can lead to more accurate analysis, quicker decision-making, and ultimately, better trading outcomes.
Customizing Chart Layouts and Interfaces
TrendSpider allows you to customize chart layouts and interfaces to match your trading style. Whether you prefer a simple layout or a more complex setup with multiple indicators and timeframes, TrendSpider can accommodate your needs.
- Choosing Chart Types and Timeframes: Select from various chart types (like candlestick, bar, line) and timeframes that suit your trading strategy.
- Arranging Your Workspace: Organize your workspace in a way that allows you to efficiently analyze the markets and execute trades.
Personalizing Technical Indicators
TrendSpider offers a wide array of technical indicators, which you can customize to fit your analysis style.
- Selecting Indicators: Choose indicators that align with your trading strategy, whether it’s trend following, momentum-based, or mean-reversion.
- Adjusting Indicator Settings: Fine-tune the settings of each indicator (like period lengths for moving averages) to match your specific requirements.
Setting Up Custom Alerts
Custom alerts are a powerful feature in TrendSpider. You can set alerts based on price movements, indicator values, or even complex technical criteria, ensuring you never miss a trading opportunity.
Integrating Risk Management Tools
Customize TrendSpider’s risk management tools, such as stop loss and take profit levels, to align with your risk tolerance and trading strategy.
Best Practices for Customizing TrendSpider
To effectively customize TrendSpider:
- Experiment with Different Settings: Don’t hesitate to try out different settings and layouts to find what works best for you.
- Keep It Simple: Start with a simpler setup and gradually add more complexity as needed.
- Regularly Review and Update Your Setup: As your trading style evolves, so should your TrendSpider customization.
Conclusion
In this comprehensive guide, we’ve explored the various facets of TrendSpider, a powerful tool designed to cater to the diverse needs of traders. From getting started with the platform to leveraging its advanced features for chart analysis, automated technical analysis, and risk management, TrendSpider stands out as a versatile ally in the world of trading.
We delved into the significance of integrating market data with technical indicators, the advantages of backtesting strategies, and the importance of being part of an educational community. Moreover, we highlighted how customizing TrendSpider to align with your unique trading style can significantly enhance your trading experience.
Key Takeaways
- TrendSpider’s Versatility: Whether you are a beginner or an experienced trader, TrendSpider offers tools and features that can be tailored to your level of expertise and trading style.
- Educational Value: The platform is not just a technical tool but also a resource for continuous learning and improvement, with its extensive educational materials and active trading community.
- Customization and Efficiency: The ability to customize the platform to your specific needs allows for more efficient and effective trading analysis and execution.
Embracing Continuous Learning and Adaptation
Remember, the world of trading is dynamic, and continuous learning is key to staying ahead. TrendSpider’s resources and community provide an excellent opportunity for ongoing education and skill enhancement. Embrace these resources, and be open to adapting your strategies as markets evolve.
Your Journey with TrendSpider
As you continue your trading journey with TrendSpider, keep experimenting with its various features and tools. The platform is designed to grow with you, adapting to your changing needs and helping you refine your trading strategies for better decision-making and improved outcomes.
Final Thoughts
TrendSpider is more than just a trading tool; it’s a comprehensive platform that supports your growth as a trader. By fully utilizing its features and staying engaged with its community, you can unlock new levels of insight and efficiency in your trading endeavors.